Glossary of terms
Flow - a data story presentation that has been constructed using the Flow Editor.
Data Value (or "Dot") - Data values within Flows are represented by "Dots" that appear at the appropriate locations within the 3-D space. The size of the Dot may provide a visual indication of the magnitude of the data value represented by the Dot. The color of the Dot may also provide useful information about the data value.
CSV File - A comma-delimited data file that is used to populate data into a Swarm. The rules regarding the content of Flow CSV files are described ** The link needs to be redone here.
Swarm - A Swarm is our made-up name for our visualizations, and think of it as a way to arrange data points into 3D space. A swarm can be used in any number of Steps. Each Dot in the Swarm represents one value of the data field of interest.
Chart - There are various ways to arrange the data in space, and the big-picture algorithm to be used is selected in the Chart pulldown. The Scatterplot is the most common chart and provides a basis for many visualizations. Some scatterplot variations may be used to generate innovative and eye-catching visualizations.
Step - A Flow presentation is comprised of one or more Steps. A Step is equivalent to a slide within a PowerPoint presentation. A Flow can contain any number of Steps. The visual content is often referred to as a Scene.
Timeline - The Timeline (also referred to as the Data Objects Timeline) is displayed across the bottom of the Flow Editor screen. The Timeline shows objects (Swarms, Connections, Area Charts, Labels, Texts, Images, Buttons) that are visible on each Step within a Flow. Double-click items to show or hide them on a particular step.
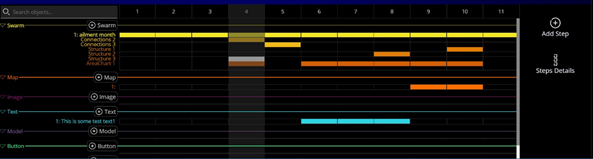
The example above shows the Timeline for a Flow consisting of 11 Steps, 1 Swarm, 2 Connections, 3 sets of Labels, 1 Area Chart, 1 Map and 1 Text object. Colored cells indicate on which Steps the various objects are visible.
Connections - Connections are used to specify how data values are interconnected by straight lines. Connections are typically used to join matching categories of data or draw down to an axis. A Connections object is always a component of a Swarm.
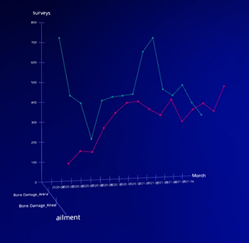
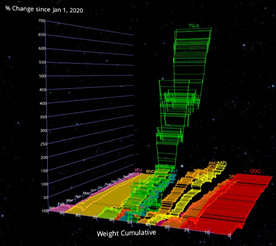
The above examples show simple and complex swarms in which data values are connected by Connections.
Labels - Labels are text values that appear adjacent to associated Swarm dots. A labels object is always a Component of a Swarm. Labels can show any of the attributes associated with a dot, and may be shown conditionally, such as to display the values at the end of a line or the maximum value of a category.
Area chart - Area charts in Flow create a filled-in plane between a data series and an axis. An area chart is always a Component of a Swarm.
Legend - A Legend is a Swarm Component showing categories visible in the swarm. A Legend is usually colorized, and is often interactive.
Filters - A Filter consists of logic for selecting a subset of rows from a Swarm. Filter elements can be grouped to form a composite filter that consists of multiple "and" or "or" conditions for selecting rows from the Swarm.
Perspectives - A group of settings for a Swarm that is unique for a single step. Naming and managing of Perspectives is performed automatically. To manage the Perspectives manually, select the Advanced checkbox on, and a drop-down will appear in the Swarm settings panel.
Other Items - Information regarding Axis Settings, Story Creator, Methods of Presenting Flows, Interactions, Text and Images, etc. is (or will be) available in other articles in our Help Center.
No Comments